SciChart.js JavaScript 2D Charts API > 2D Chart Types > Series Hit Test API > Hit-Test API and Metadata
Hit-Test API and Metadata

Calling any of Hit-Test methods produces a HitTestInfo object as a result. The HitTestInfo object has metadata property. It contains the point metadata from associated data series, which is useful for displaying any additional information for the data point.

Let's create a column chart with metadata for Forbes world's billionaires.

First we will create ForbesMetadata class by implementing IPointMetadata interface.

export class ForbesMetadata {
    constructor(name, age, country) {
        this.name = name;
        this.country = country;
        this.age = age;
    }
}
import { IPointMetadata } from 'scichart/Charting/Model/IPointMetadata';
export class ForbesMetadata implements IPointMetadata {
    public isSelected: boolean = false;
    public name: string;
    public country: string;
    public age: number;
    constructor(name: string, age: number, country: string) {
        this.name = name;
        this.country = country;
        this.age = age;
    }
}

 Next we create an array with the Forbes data.

export const forbesData = [
    [203.4, new ForbesMetadata('Elon Musk', 50, 'United States')],
    [197.7, new ForbesMetadata('Jeff Bezos', 57, 'United States')],
    [175.9, new ForbesMetadata('Bernard Arnault & family', 72, 'France')],
    [131.0, new ForbesMetadata('Bill Gates', 65, 'United States')],
    [126.4, new ForbesMetadata('Mark Zuckerberg', 37, 'United States')],
    [120.7, new ForbesMetadata('Larry Page', 48, 'United States')],
    [119.6, new ForbesMetadata('Larry Ellison', 77, 'United States')],
    [116.3, new ForbesMetadata('Sergey Brin', 48, 'United States')],
    [101.5, new ForbesMetadata('Warren Buffett', 91, 'United States')],
    [98.5, new ForbesMetadata('Mukesh Ambani', 64, 'India')]
];
export const forbesData: Array<[number, ForbesMetadata]> = [
    [203.4, new ForbesMetadata('Elon Musk', 50, 'United States')],
    [197.7, new ForbesMetadata('Jeff Bezos', 57, 'United States')],
    [175.9, new ForbesMetadata('Bernard Arnault & family', 72, 'France')],
    [131.0, new ForbesMetadata('Bill Gates', 65, 'United States')],
    [126.4, new ForbesMetadata('Mark Zuckerberg', 37, 'United States')],
    [120.7, new ForbesMetadata('Larry Page', 48, 'United States')],
    [119.6, new ForbesMetadata('Larry Ellison', 77, 'United States')],
    [116.3, new ForbesMetadata('Sergey Brin', 48, 'United States')],
    [101.5, new ForbesMetadata('Warren Buffett', 91, 'United States')],
    [98.5, new ForbesMetadata('Mukesh Ambani', 64, 'India')]
];

This is the bit where we use this data to fill XyDataSeries.

Filling XyDataSeries
Copy Code
const dataSeries = new XyDataSeries(wasmContext);
forbesData.forEach((data, i) => dataSeries.append(i + 1, data[0], data[1]));

 This is the full example of metadata usage for a line chart.

import { SciChartSurface } from 'scichart/Charting/Visuals/SciChartSurface';
import { NumericAxis } from 'scichart/Charting/Visuals/Axis/NumericAxis';
import { NumberRange } from 'scichart/Core/NumberRange';
import { DpiHelper } from 'scichart/Charting/Visuals/TextureManager/DpiHelper';
import { CustomAnnotation } from 'scichart/Charting/Visuals/Annotations/CustomAnnotation';
import { EHorizontalAnchorPoint, EVerticalAnchorPoint } from 'scichart/types/AnchorPoint';
import { XyDataSeries } from 'scichart/Charting/Model/XyDataSeries';
import { forbesData } from './metadata.js';
import { FastColumnRenderableSeries } from 'scichart/Charting/Visuals/RenderableSeries/FastColumnRenderableSeries';
export async function hitTestLineMetadata(divId) {
    const { sciChartSurface, wasmContext } = await SciChartSurface.create(divId);
    const HIT_TEST_RADIUS = 10 * DpiHelper.PIXEL_RATIO;
    const xAxis = new NumericAxis(wasmContext, { axisTitle: 'Forbes Rank' });
    xAxis.labelProvider.precision = 0;
    sciChartSurface.xAxes.add(xAxis);
    const yAxis = new NumericAxis(wasmContext, { growBy: new NumberRange(0.05, 0.05), axisTitle: 'Net Worth, bln $' });
    yAxis.labelProvider.precision = 0;
    sciChartSurface.yAxes.add(yAxis);
    const dataSeries = new XyDataSeries(wasmContext);
    forbesData.forEach((data, i) => dataSeries.append(i + 1, data[0], data[1]));
    const columnSeries = new FastColumnRenderableSeries(wasmContext, {
        fill: '#228B22',
        dataSeries
    });
    sciChartSurface.renderableSeries.add(columnSeries);
    // Add an SVG annotation to display the mouse click
    const svgAnnotation = new CustomAnnotation({
        svgString: `<svg width="8" height="8"><circle cx="50%" cy="50%" r="4" fill="#FF0000"/></svg>`,
        isHidden: true,
        horizontalAnchorPoint: EHorizontalAnchorPoint.Center,
        verticalAnchorPoint: EVerticalAnchorPoint.Center
    });
    sciChartSurface.annotations.add(svgAnnotation);
    sciChartSurface.domCanvas2D.addEventListener('mousedown', (mouseEvent) => {
        const mouseClickX = mouseEvent.offsetX;
        const mouseClickY = mouseEvent.offsetY;
        console.log('mouseClickX', mouseClickX, 'mouseClickY', mouseClickY);
        const premultipliedX = mouseEvent.offsetX * DpiHelper.PIXEL_RATIO;
        const premultipliedY = mouseEvent.offsetY * DpiHelper.PIXEL_RATIO;
        console.log('premultipliedX', premultipliedX, 'premultipliedY', premultipliedY);
        // IHitTestProvider.hitTest
        const hitTestInfo = columnSeries.hitTestProvider.hitTest(premultipliedX, premultipliedY, HIT_TEST_RADIUS);
        svgAnnotation.x1 = hitTestInfo.hitTestPointValues.x;
        svgAnnotation.y1 = hitTestInfo.hitTestPointValues.y;
        svgAnnotation.isHidden = false;
        const resultDiv = document.getElementById('result');
        const meta = hitTestInfo.metadata;
        if (hitTestInfo.isHit) {
            resultDiv.innerText = `Name: ${meta.name}, Age: ${meta.age}, Country: ${meta.country}`;
        } else {
            resultDiv.innerText = '';
        }
        console.log('hitTestInfo', hitTestInfo);
    });
}
import { SciChartSurface } from 'scichart/Charting/Visuals/SciChartSurface';
import { NumericAxis } from 'scichart/Charting/Visuals/Axis/NumericAxis';
import { NumberRange } from 'scichart/Core/NumberRange';
import { DpiHelper } from 'scichart/Charting/Visuals/TextureManager/DpiHelper';
import { CustomAnnotation } from 'scichart/Charting/Visuals/Annotations/CustomAnnotation';
import { EHorizontalAnchorPoint, EVerticalAnchorPoint } from 'scichart/types/AnchorPoint';
import { XyDataSeries } from 'scichart/Charting/Model/XyDataSeries';
import { forbesData, ForbesMetadata } from './metadataTs';
import { FastColumnRenderableSeries } from 'scichart/Charting/Visuals/RenderableSeries/FastColumnRenderableSeries';
export async function hitTestLineMetadataTs(divId: string) {
    const { sciChartSurface, wasmContext } = await SciChartSurface.create(divId);
    const HIT_TEST_RADIUS = 10 * DpiHelper.PIXEL_RATIO;
    const xAxis = new NumericAxis(wasmContext, { axisTitle: 'Forbes Rank' });
    xAxis.labelProvider.precision = 0;
    sciChartSurface.xAxes.add(xAxis);
    const yAxis = new NumericAxis(wasmContext, { growBy: new NumberRange(0.05, 0.05), axisTitle: 'Net Worth, bln $' });
    yAxis.labelProvider.precision = 0;
    sciChartSurface.yAxes.add(yAxis);
    const dataSeries = new XyDataSeries(wasmContext);
    forbesData.forEach((data, i) => dataSeries.append(i + 1, data[0], data[1]));
    const columnSeries = new FastColumnRenderableSeries(wasmContext, {
        fill: '#228B22',
        dataSeries
    });
    sciChartSurface.renderableSeries.add(columnSeries);
    // Add an SVG annotation to display the mouse click
    const svgAnnotation = new CustomAnnotation({
        svgString: `<svg width="8" height="8"><circle cx="50%" cy="50%" r="4" fill="#FF0000"/></svg>`,
        isHidden: true,
        horizontalAnchorPoint: EHorizontalAnchorPoint.Center,
        verticalAnchorPoint: EVerticalAnchorPoint.Center
    });
    sciChartSurface.annotations.add(svgAnnotation);
    sciChartSurface.domCanvas2D.addEventListener('mousedown', (mouseEvent: MouseEvent) => {
        const mouseClickX = mouseEvent.offsetX;
        const mouseClickY = mouseEvent.offsetY;
        console.log('mouseClickX', mouseClickX, 'mouseClickY', mouseClickY);
        const premultipliedX = mouseEvent.offsetX * DpiHelper.PIXEL_RATIO;
        const premultipliedY = mouseEvent.offsetY * DpiHelper.PIXEL_RATIO;
        console.log('premultipliedX', premultipliedX, 'premultipliedY', premultipliedY);
        // IHitTestProvider.hitTest
        const hitTestInfo = columnSeries.hitTestProvider.hitTest(premultipliedX, premultipliedY, HIT_TEST_RADIUS);
        svgAnnotation.x1 = hitTestInfo.hitTestPointValues.x;
        svgAnnotation.y1 = hitTestInfo.hitTestPointValues.y;
        svgAnnotation.isHidden = false;
        const resultDiv = document.getElementById('result');
        const meta = hitTestInfo.metadata as ForbesMetadata;
        if (hitTestInfo.isHit) {
            resultDiv.innerText = `Name: ${meta.name}, Age: ${meta.age}, Country: ${meta.country}`;
        } else {
            resultDiv.innerText = '';
        }
        console.log('hitTestInfo', hitTestInfo);
    });
}

 This is the resulting column chart.

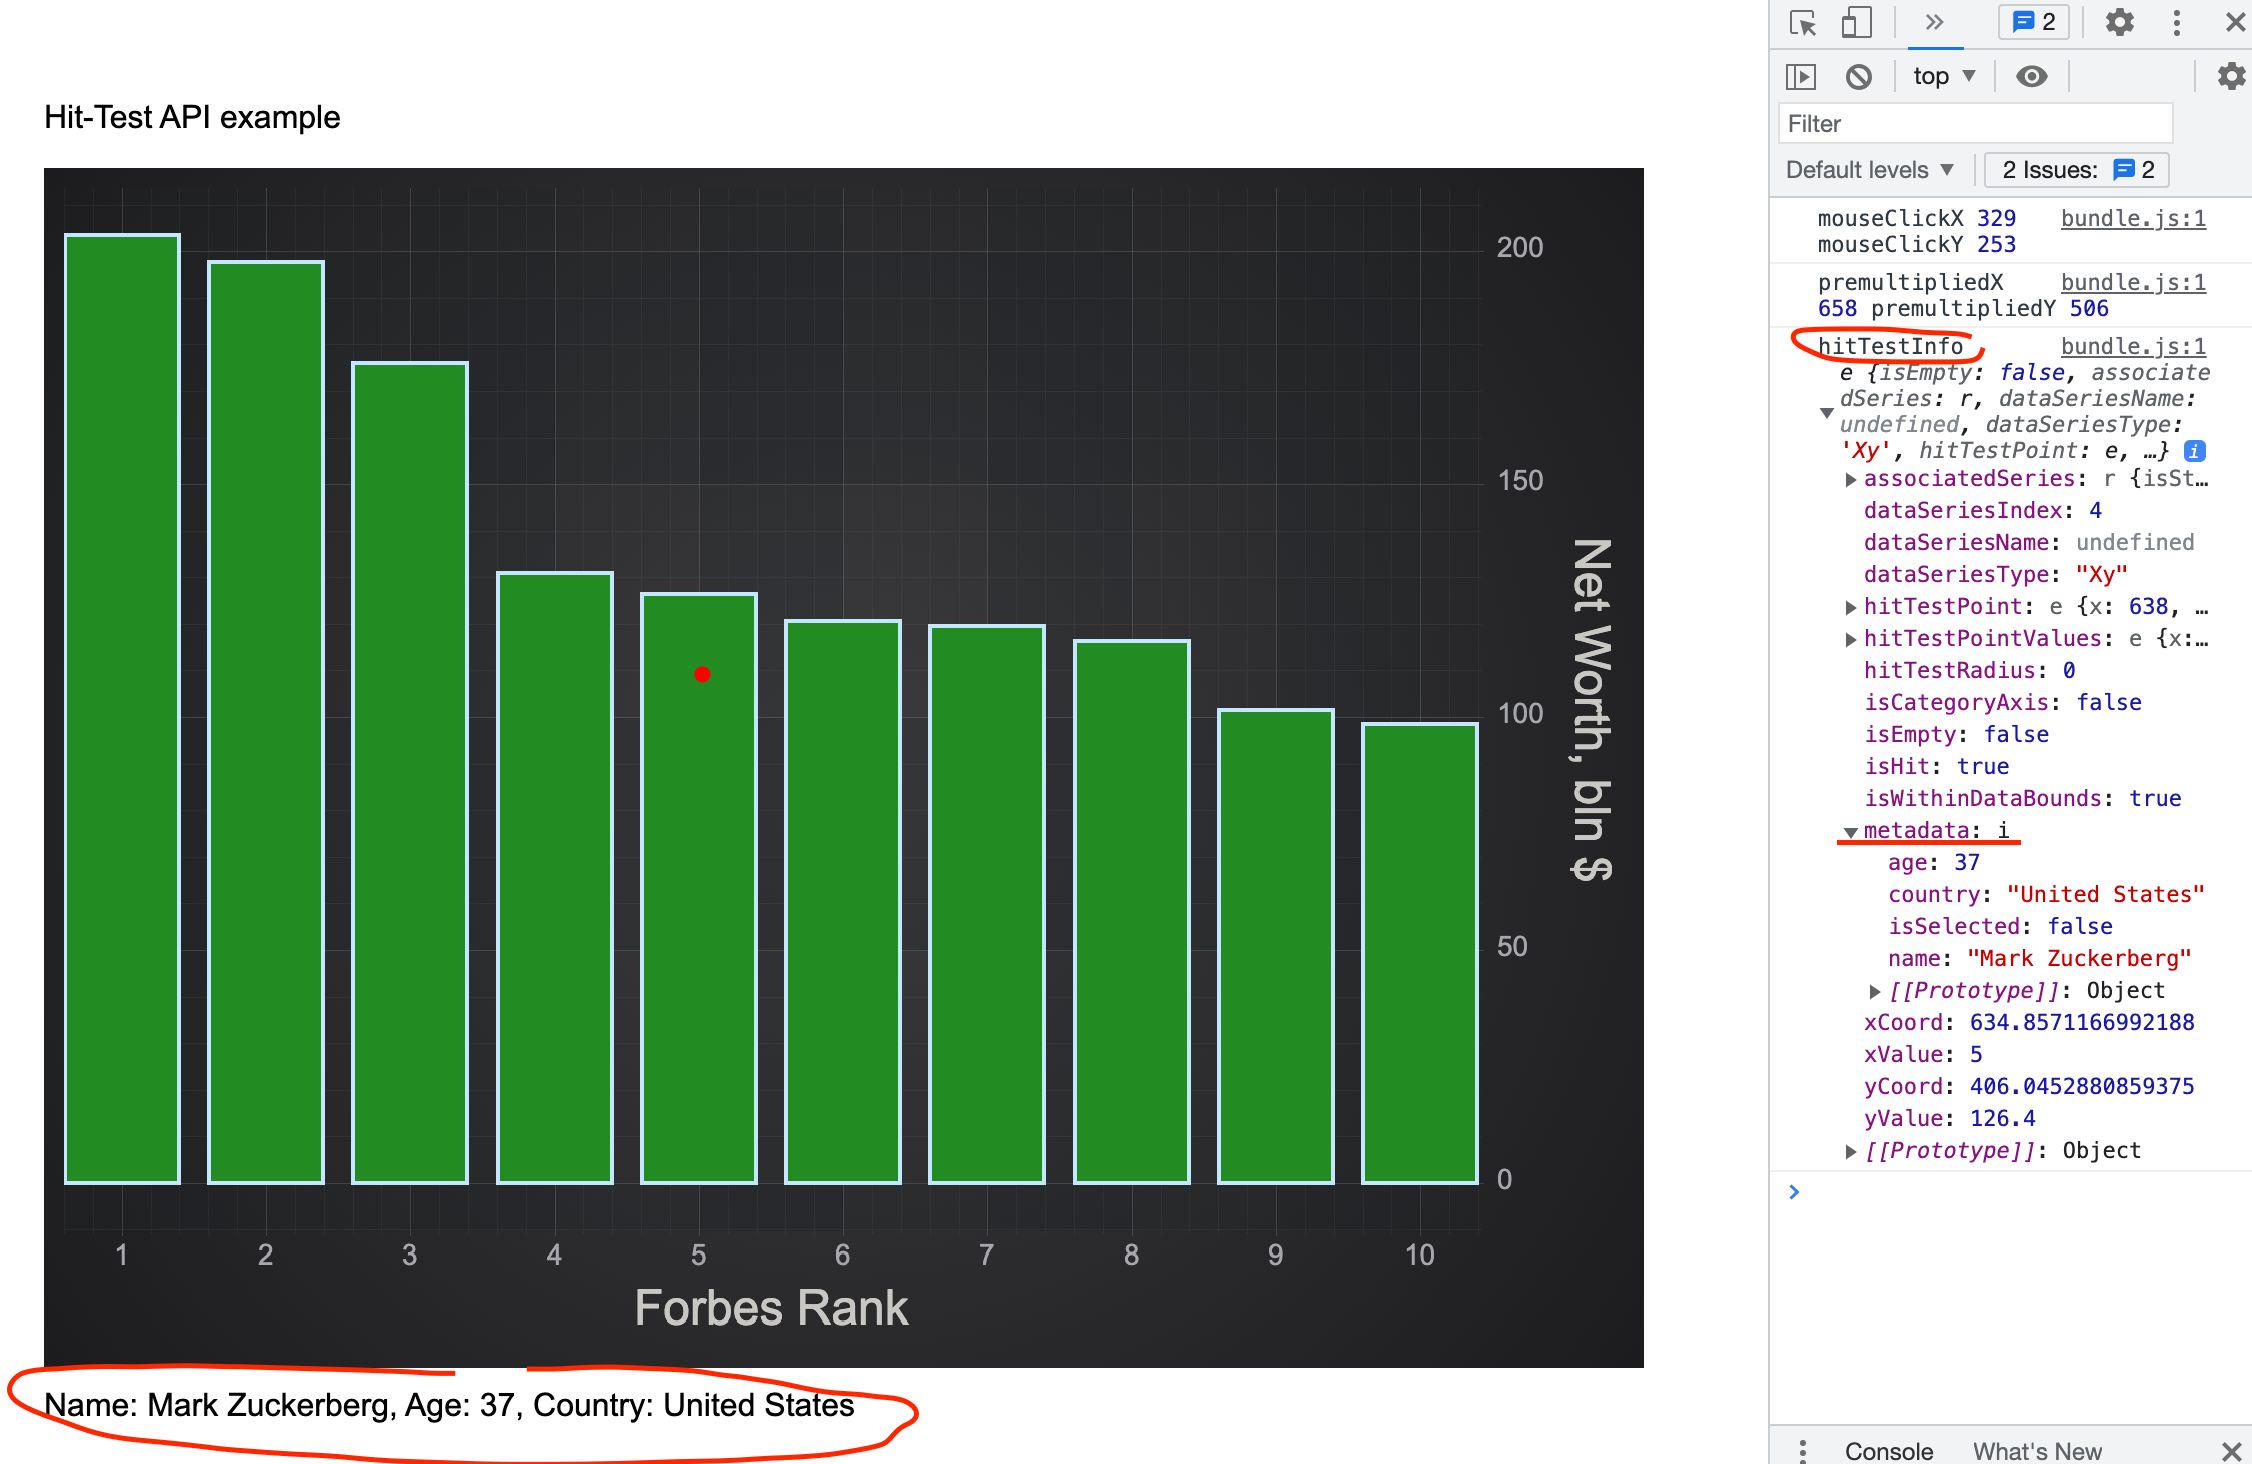
 If we click on the column we get metadata displayed at the bottom of the chart. In the browser console you will find output with the metadata property which contains Name, Age, Country and isSelected fields. The isSelected is a common property, which is used to select/deselect data points.

See Also